

Spoiler alert: it differs by region.
At Agero, we are continuously learning from the more than ten million roadside events we help drivers with each year. We use the roughly 11TB of data generated from these incidents to inform the business decisions we make, the products we build, and the services we provide to our clients and their customers. We can also use this data to analyze car traffic trends and make sense of what’s happening on the roads across the country.
With the holiday season upon us, we turned to the data to see how traffic volume during the holidays in 2020 might be different from trends in years past.
2020 Traffic volume plummeted early, but it's bouncing back
Our data indicates that, year over year, the overall volume of incidents was down roughly 12% in the first 10 months of 2020 compared to the same timeframe in 2019. That overall number includes a much larger drop off in April and early May, roughly 30-40%, caused by the widespread shutdowns at the outset of the pandemic that ground car travel to a halt. Gradually, roadside activity began resuming. By mid-May we saw drop offs of only 15%. By the week of Thanksgiving 2020, roadside events were down by less than 10% year over year.
The question is, should we be expecting a big change in the volume of cars on the road during the December holidays compared to a typical year?
It’s worth noting here that many local, state, and national authorities have been recommending that people stay home for the holidays to prevent the spread of the coronavirus. In addition, at the time of writing 21 states plus Washington D.C. have active travel restrictions such as quarantine periods or guidelines requiring that travelers show proof of a negative Covid test shortly after arriving.
Before we get into our analysis, first a bit on our approach. Unlike in other sectors of the transportation industry, there isn’t a precise way to count how many cars are on the road at any given time – or determine where drivers might be going. That said, our data on common roadside events offers a reasonable approximation for total motor vehicle traffic and high-level trends. When we see an uptick in roadside events, it most likely reflects more cars on the road and likewise, fewer roadside incidents generally reflects a drop in traffic volume. There could be many reasons that the volume of traffic and number of roadside event patterns might diverge, but for the sake of this analysis we'll stick with that presumption.
CHRISTMAS 2020 PROJECTION: Lighter traffic, except for a few states
With that out of the way, here's where we landed on a forecast for the week of Christmas 2020 compared to the road volume trends from 2019:
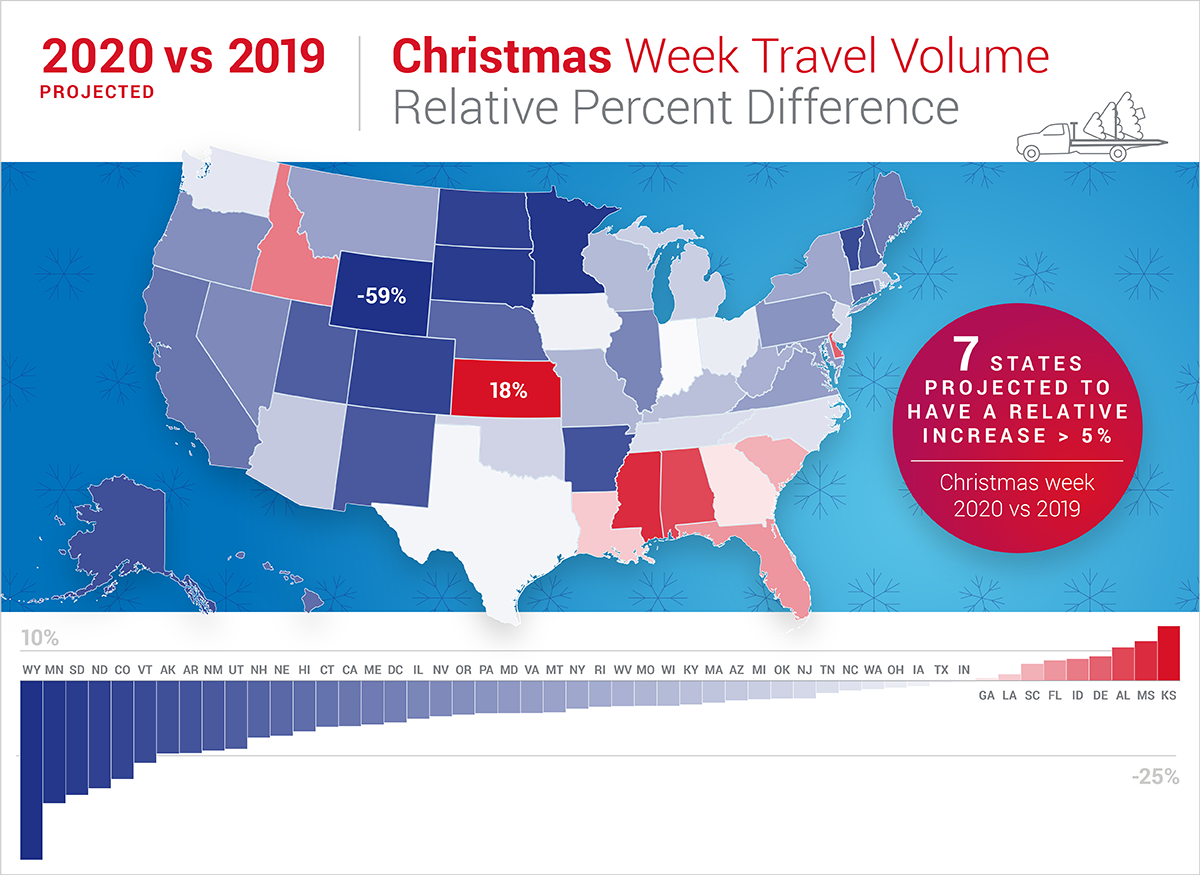
This chart provides a state-by-state projection of how we expect traffic volume during the week of Christmas 2020 to compare to Christmas 2019. The states marked in red are locations where we expect there to be more car traffic compared to last year. The states marked in blue are locations where we expect less travel during Christmas week this year.
As you can see, we expect relatively quiet roads throughout most of the country. The only areas where there might be relative increases in traffic are the Southeast, plus Kansas, Idaho and Delaware.
Now a quick look into how we arrived at that projection.
CAR VOLUME DECREASES during THANKSGIVING WEEK – Who knew?
First, we compared the amount of average weekly volume during the first three weeks of November for 2019 to the volume for the week of Thanksgiving in 2019. That comparison is visualized here:
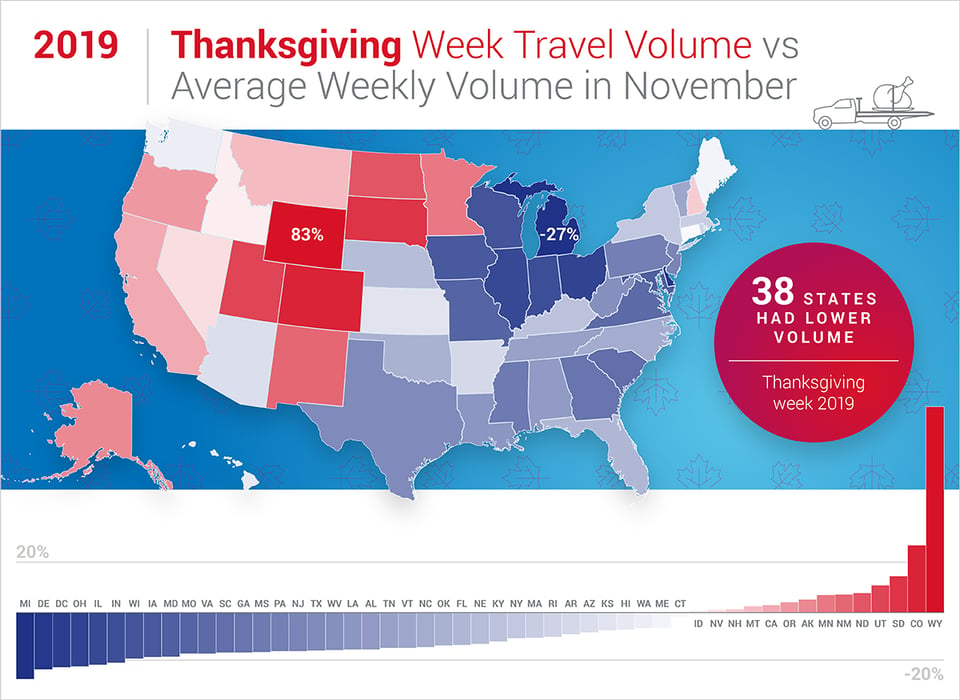
Fun fact: during a normal year, most of the western states see higher car volume during the week of Thanksgiving, while the rest of the country sees a drop in traffic. The result is a net decrease in volume.
Then we did the same for 2020, analyzing the average weekly volume for the first three weeks of November to the week of Thanksgiving:
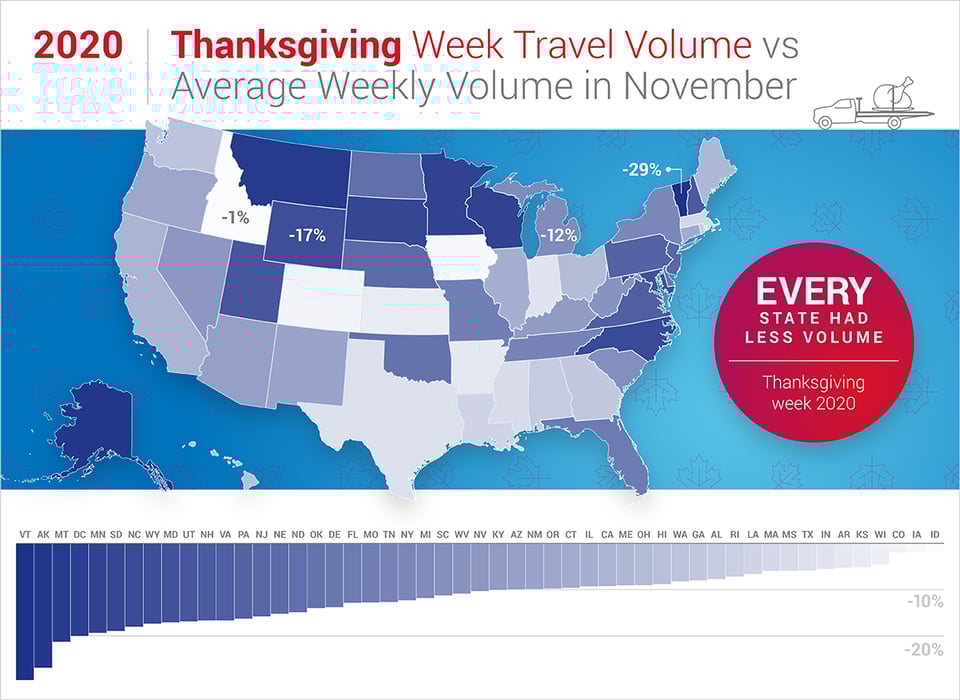
Here you can see that every single state had lower volume during the week of Thanksgiving 2020 than the average weekly volume from earlier in the month.
Wait a second – isn't Thanksgiving one of the busiest travel periods of the year? Yes, it is. But in terms of automotive traffic, the increase in activity on the roads that Wednesday is likely outweighed by the drop off in traffic from the Thursday and Friday of that week, when many businesses are closed and, therefore, far fewer people are driving to work. In addition, many people typically leave the car at home and fly to their Thanksgiving destinations.
Comparing the activity around Thanksgiving from year to year, the difference was relatively small overall – with a 1-2% aggregate volume increase in 2020 relative to 2019. At the state level, there was quite a bit more variation.
In the chart below, we compared the expected volume for Thanksgiving week based on 2019 patterns, with an adjustment for the overall lower volume trends that we've seen in 2020. What we clearly see is that 2020 did not follow the typical Thanksgiving pattern of recent years, likely due to COVID restrictions and risks affecting people’s holiday plans. The chart below shows the relative percent difference of what we would have expected the 2020 Thanksgiving holiday volume to be compared to what it was. The states marked in red suggests that more people in that state drove during Thanksgiving week than would have been expected based on 2019 trends; the states marked in blue indicates relatively less driving during Thanksgiving week.
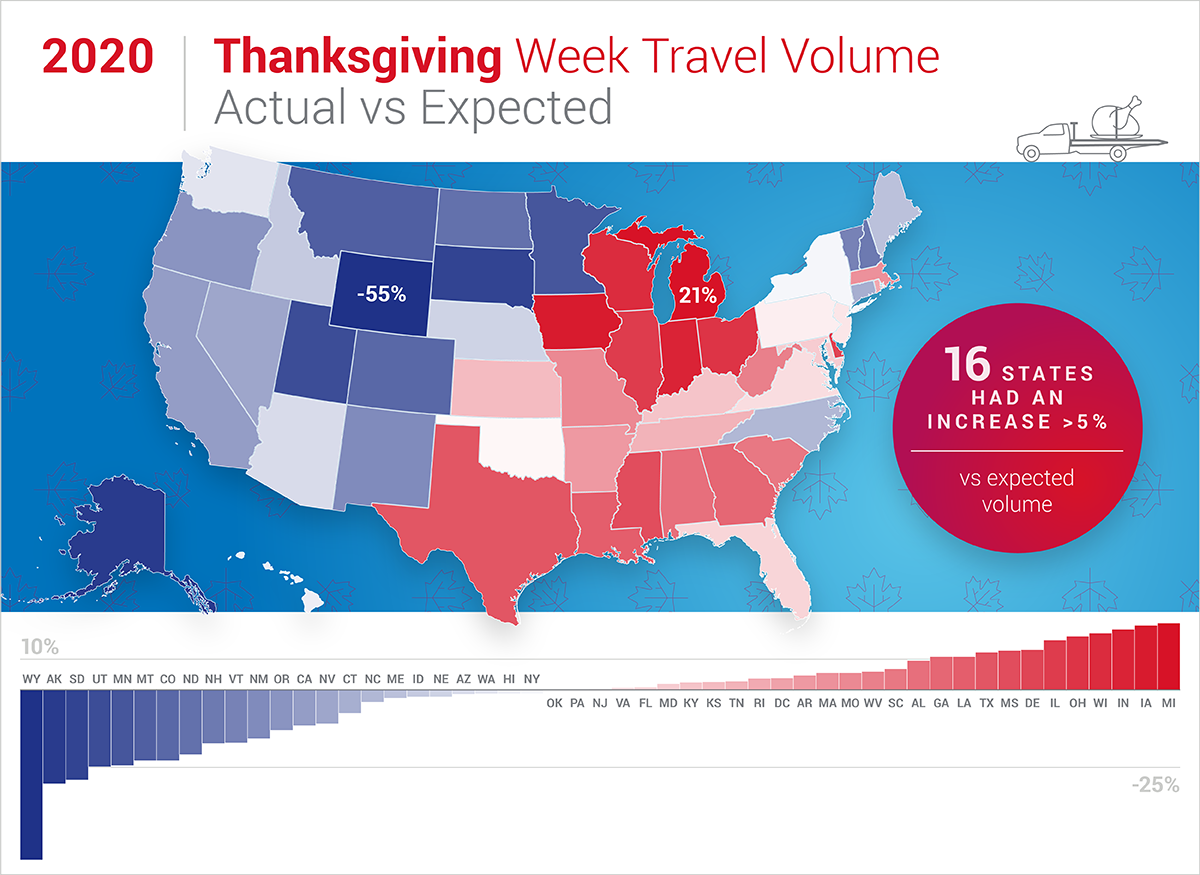
The most striking feature of this figure is that it has near-opposite trends when you compare it to the 2019 Thanksgiving travel week volume figure presented earlier.
In states where people travel more by car over Thanksgiving in a typical year, they traveled a bit less than usual by car this year. Conversely, in states that typically see a decline in car travel over the Thanksgiving holiday, we saw a relative uptick in car volume in 2020.
For example, Wyoming had a large jump (+83%) in volume during the 2019 Thanksgiving week as compared to the volume levels earlier in the month, indicating that people likely drove quite a bit more over the holiday than they usually do. For the 2020 Thanksgiving week, the state saw a -17% decline in volume levels compared to the rest of the month. That is a huge trend shift. When we compare the 2019 trend projected forward to 2020 starting volume levels, that comes out to a -55% decline in actual volume over expected.
On the other end of the spectrum, in Michigan we saw a -12% drop over Thanksgiving 2020 compared to how much people had been driving earlier in the month. However, that was less of a drop than we would have expected based on the change from typical November weeks to Thanksgiving in 2019 (-27%). Comparing the 2019 trend projected forward to 2020 and the actual 2020 numbers leads to a +21% difference in volume observed vs volume expected.
DECEMBER 2019: Quiet Roads during Christmas week
Finally, the last piece of data we used to calculate our December holiday projections were the actual numbers from December 2019, again comparing traffic volume over the first few weeks of the month to the week of Christmas.
Typically, there’s a sizable decrease in roadside activity around the December holidays as people take time off of work. Fewer commuters, fewer cars on the road. It’s also notable that, as with Thanksgiving, many people typically fly to their December holiday destinations each year, which may well contribute to less automotive traffic. That decrease is notable in the following chart, which shows the percent difference for the week of Christmas 2019 vs the average volume over the first three weeks of December 2019:
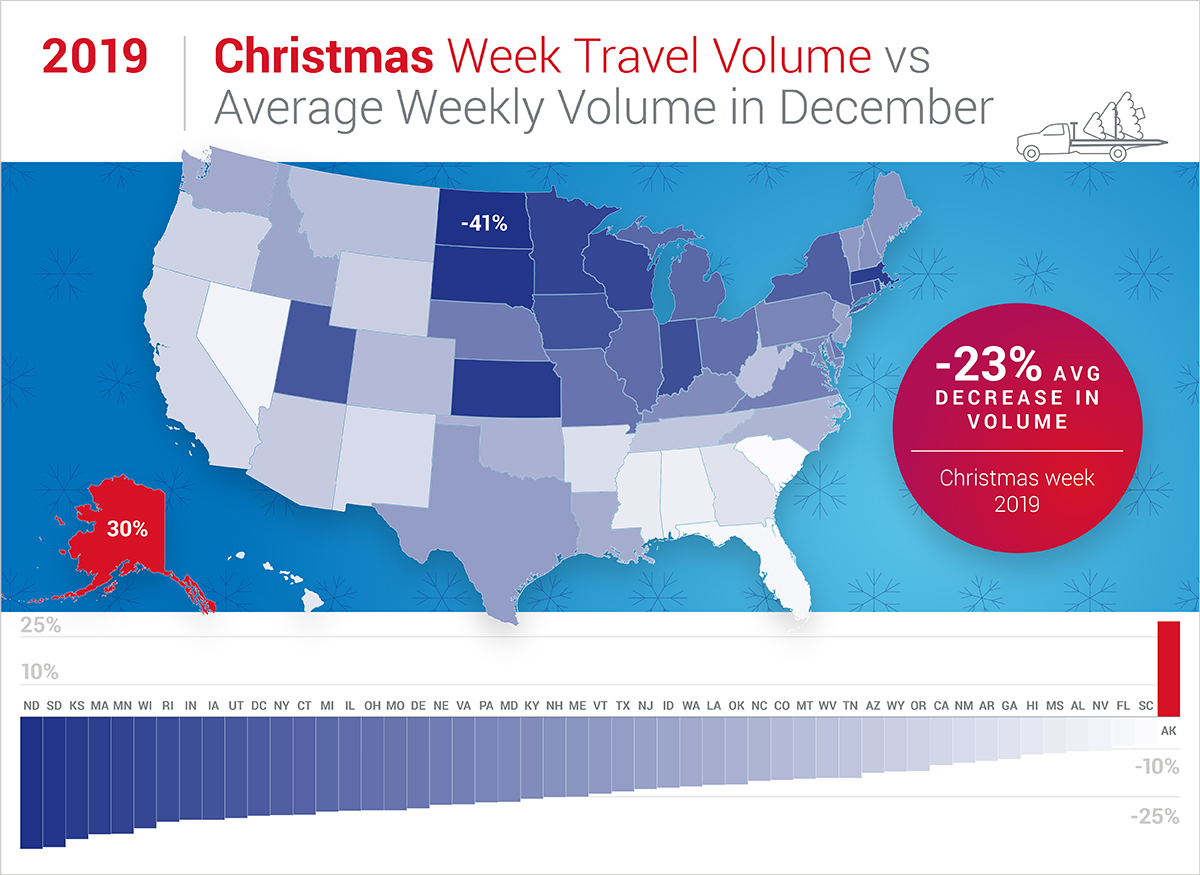
Even including Alaska, the week of Christmas 2019 saw a sizable slow down in motor vehicle traffic across the country, noted by a -23% decrease in average volume compared to the average of the prior two weeks of the month.
Will the 2019 trend hold throughout the 2020 holiday season? Or will our projections that incorporate both the differential from Thanksgiving 2019 to 2020 as well as the actuals of 2019 December traffic turn out to be more accurate? We’ll find out soon.
Most importantly, for those who are planning to hit the road around the holidays and into the new year, please stay safe, and drive with the confidence that our award-winning roadside services are always just a click, tap, or phone call away. And should you find yourself needing roadside assistance in an area with higher-than-expected traffic volume, remember that you can always skip the line by requesting assistance online or through a participating provider’s app.
 Catherine Slesnick currently leads the world class Data Science and Data Engineering team at Agero in Medford, MA. In this role, she directs the development of data analysis and machine learning models that help to safeguard drivers on the road. Prior to joining Agero, she worked at Booz Allen Hamilton as a data scientist and before that at Draper Laboratory as a data analyst. Catherine completed her Ph.D. in Astrophysics at the California Institute of Technology in 2007.
Recent Posts
Agero Launches Sixth Annual ‘Summer Hustle’ Program to Honor Top-Performing Roadside Assistance Providers
Program celebrates the service professionals who help keep drivers safe and supported during the...Driving the Future of Roadside Assistance: Agero’s Momentum and the Road Ahead
As a leading provider of roadside assistance across North America, Agero supports more than 150...Agero’s Beth Davidson Wins 2026 BostonCMO ORBIE® Award
Recognition marks rare ORBIE triple crown for Agero with award-winning CMO, CIO and CISO.MEDFORD,...